ProLog
Real-time tracking of every professional achievement, in one timeline.
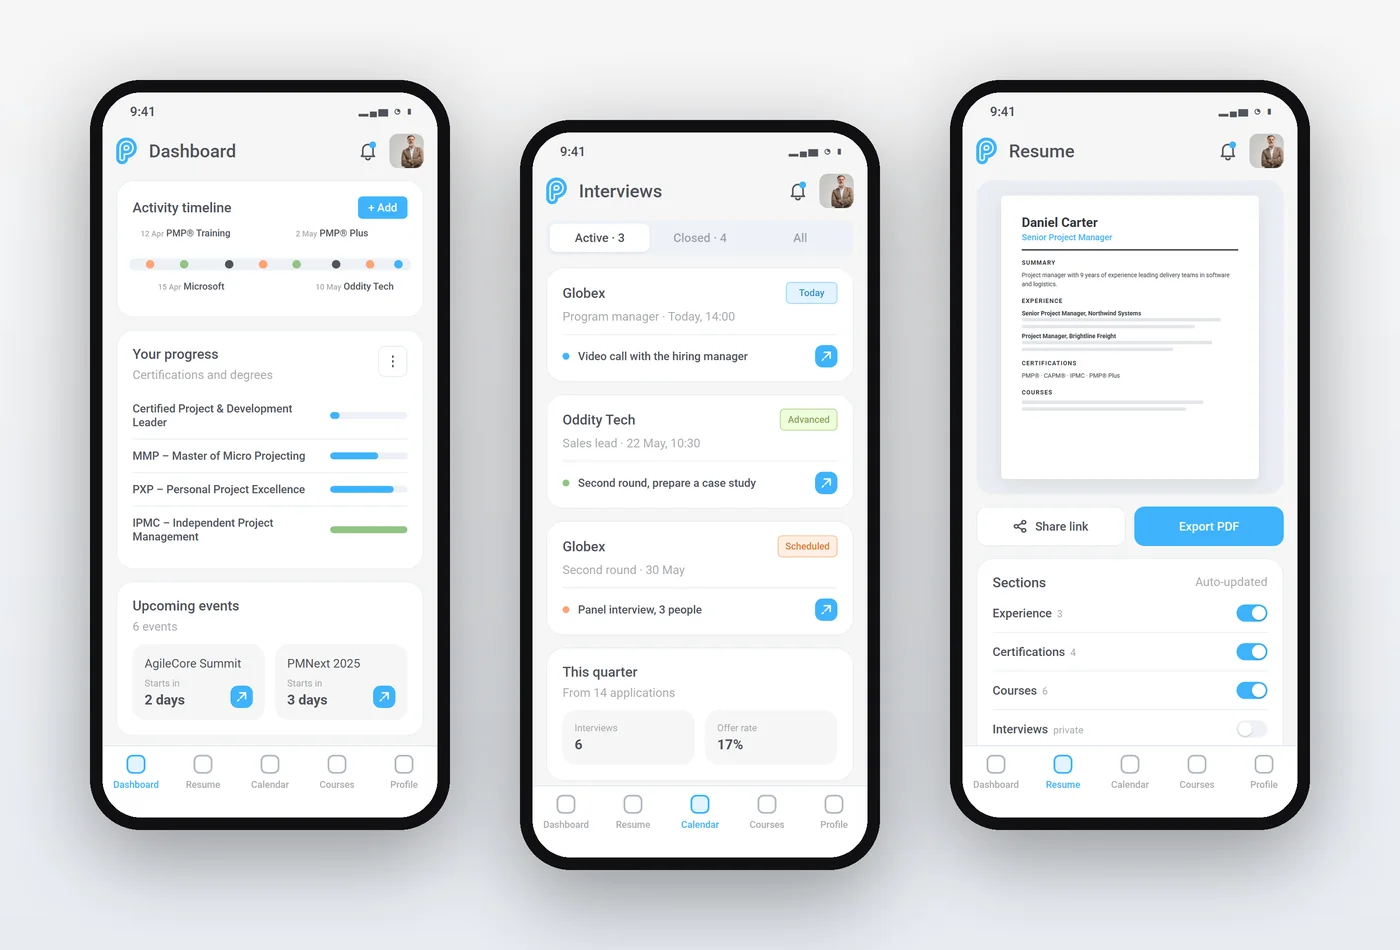
Mainly a web app with a mobile fallback. Later boards show more screens designed in the same style.
Read the case study: how it was designed →
- Role
- UI/UX Designer
- Platform
- Web
- Software
- Figma
- Design system
- Light and dark themes with sky blue and green accents
Try the prototype
A career achievement tracker, built from the Figma boards in both themes. Hover the activity timeline to read each event, zoom and pan it, filter it, or add your own. Every card reacts to hover, interview statuses can be changed, and Resume, Calendar and Courses open from the top tabs.
Open the profile menu at the top right to switch to the dark theme.
Best on a laptop or desktop screen.
The problem
Keeping track of everything that helps your career was becoming far too cumbersome.
Features
- ·AI-based tracking that brings certifications, courses, interviews and profile views into one timeline
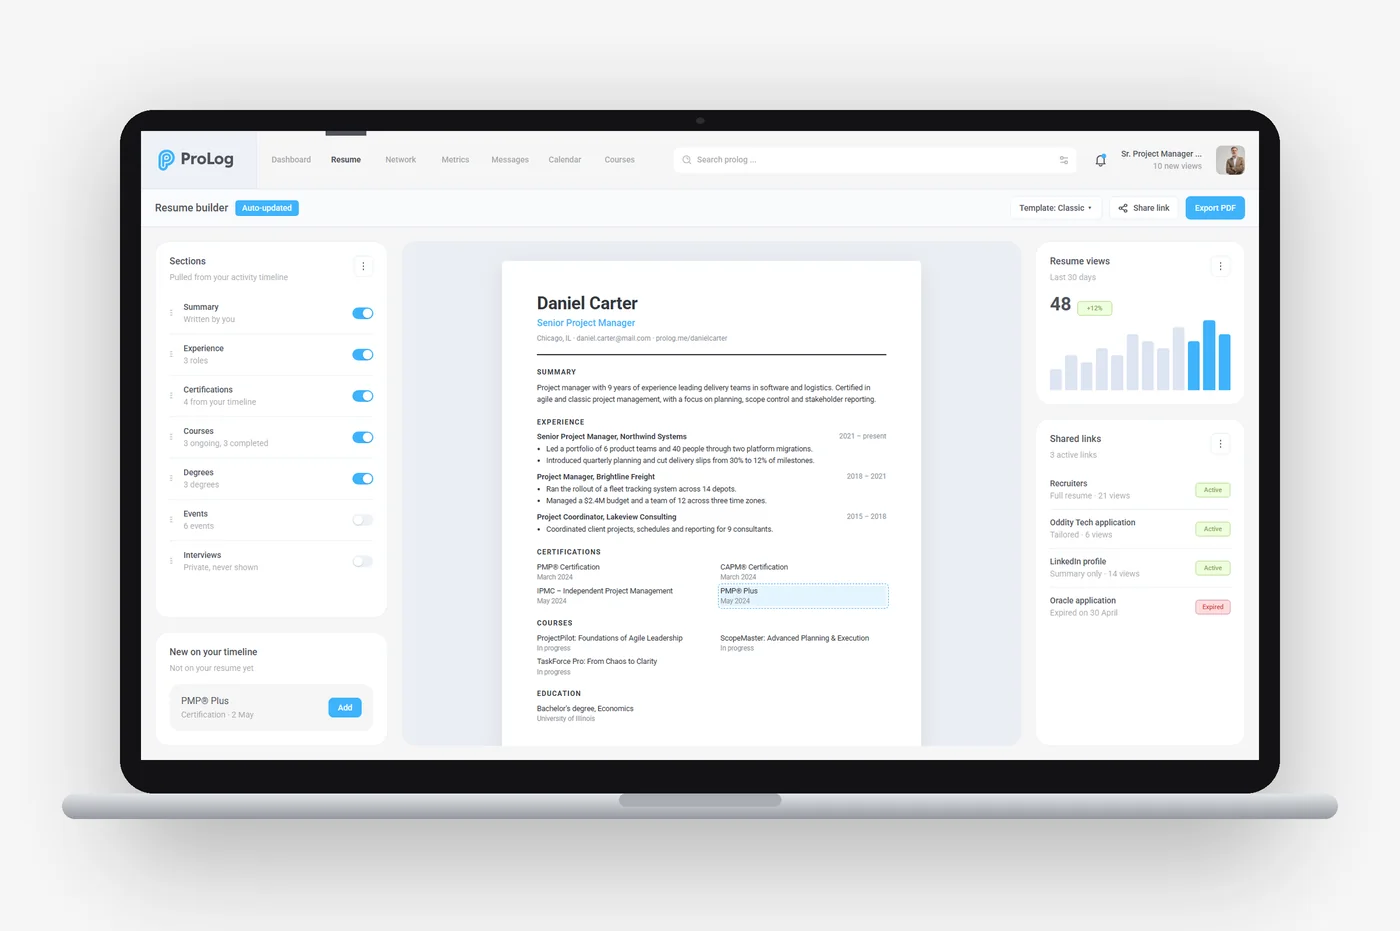
- ·Interactive prototype of the activity timeline, the resume builder and interview tracking
- ·Shareable activity timeline
- ·Certification and course progress
- ·Interview tracker
- ·Profile and resume views
Approach
- 01
Problem framing
ProblemCertifications, courses, interviews and profile views sit in separate places, so keeping track of a career becomes cumbersome.
SolutionSet out to bring every professional activity into one dashboard that updates as things happen.
- 02
Activity timeline
ProblemA plain list of events hides how they relate to each other over time.
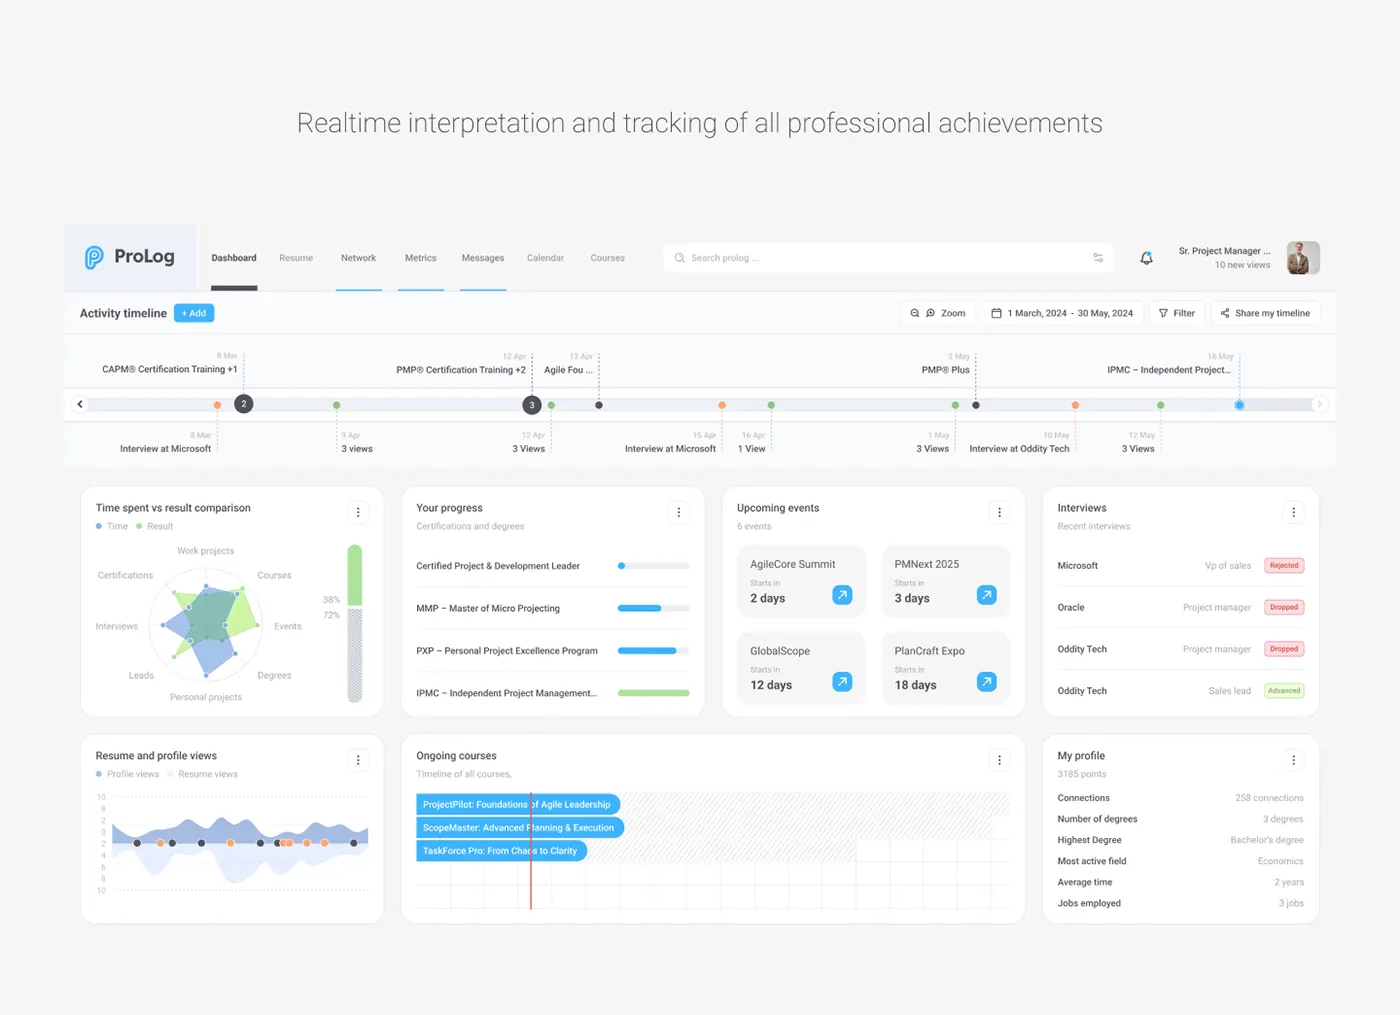
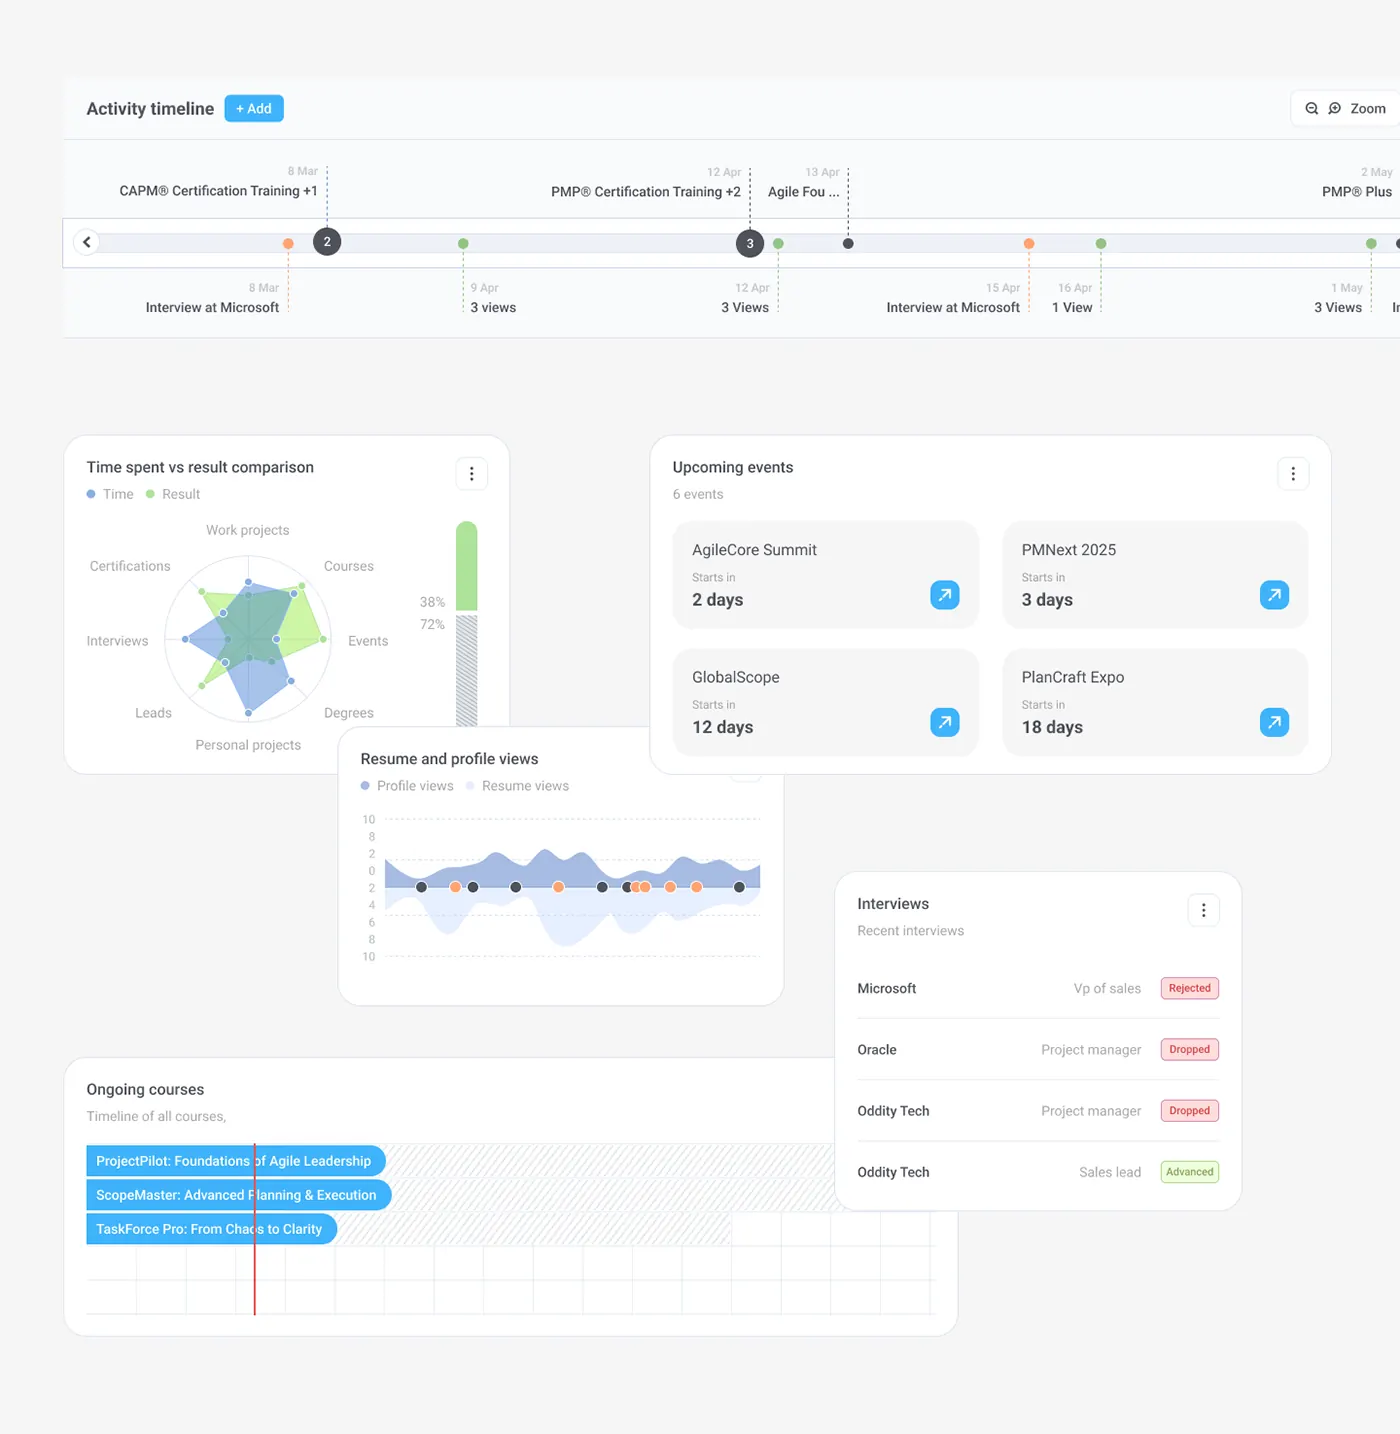
SolutionPlaced a zoomable, filterable activity timeline across the top, with colour-coded markers and numbered clusters. "Share my timeline" makes it easy to send.
- 03
Dashboard cards
ProblemEach type of activity needs to be read differently: progress, dates or outcomes.
SolutionSplit the dashboard into cards: certification progress bars, event countdowns, interviews tagged Rejected, Dropped or Advanced, and courses on a Gantt-style timeline.
- 04
Time vs results
ProblemIt was hard to tell whether the time spent on courses, events or projects was paying off.
SolutionAdded a radar chart comparing time with results across eight areas, next to a chart of resume and profile views.
- 05
Light and dark
ProblemA dense, data-heavy screen had to stay legible in both light and dark themes.
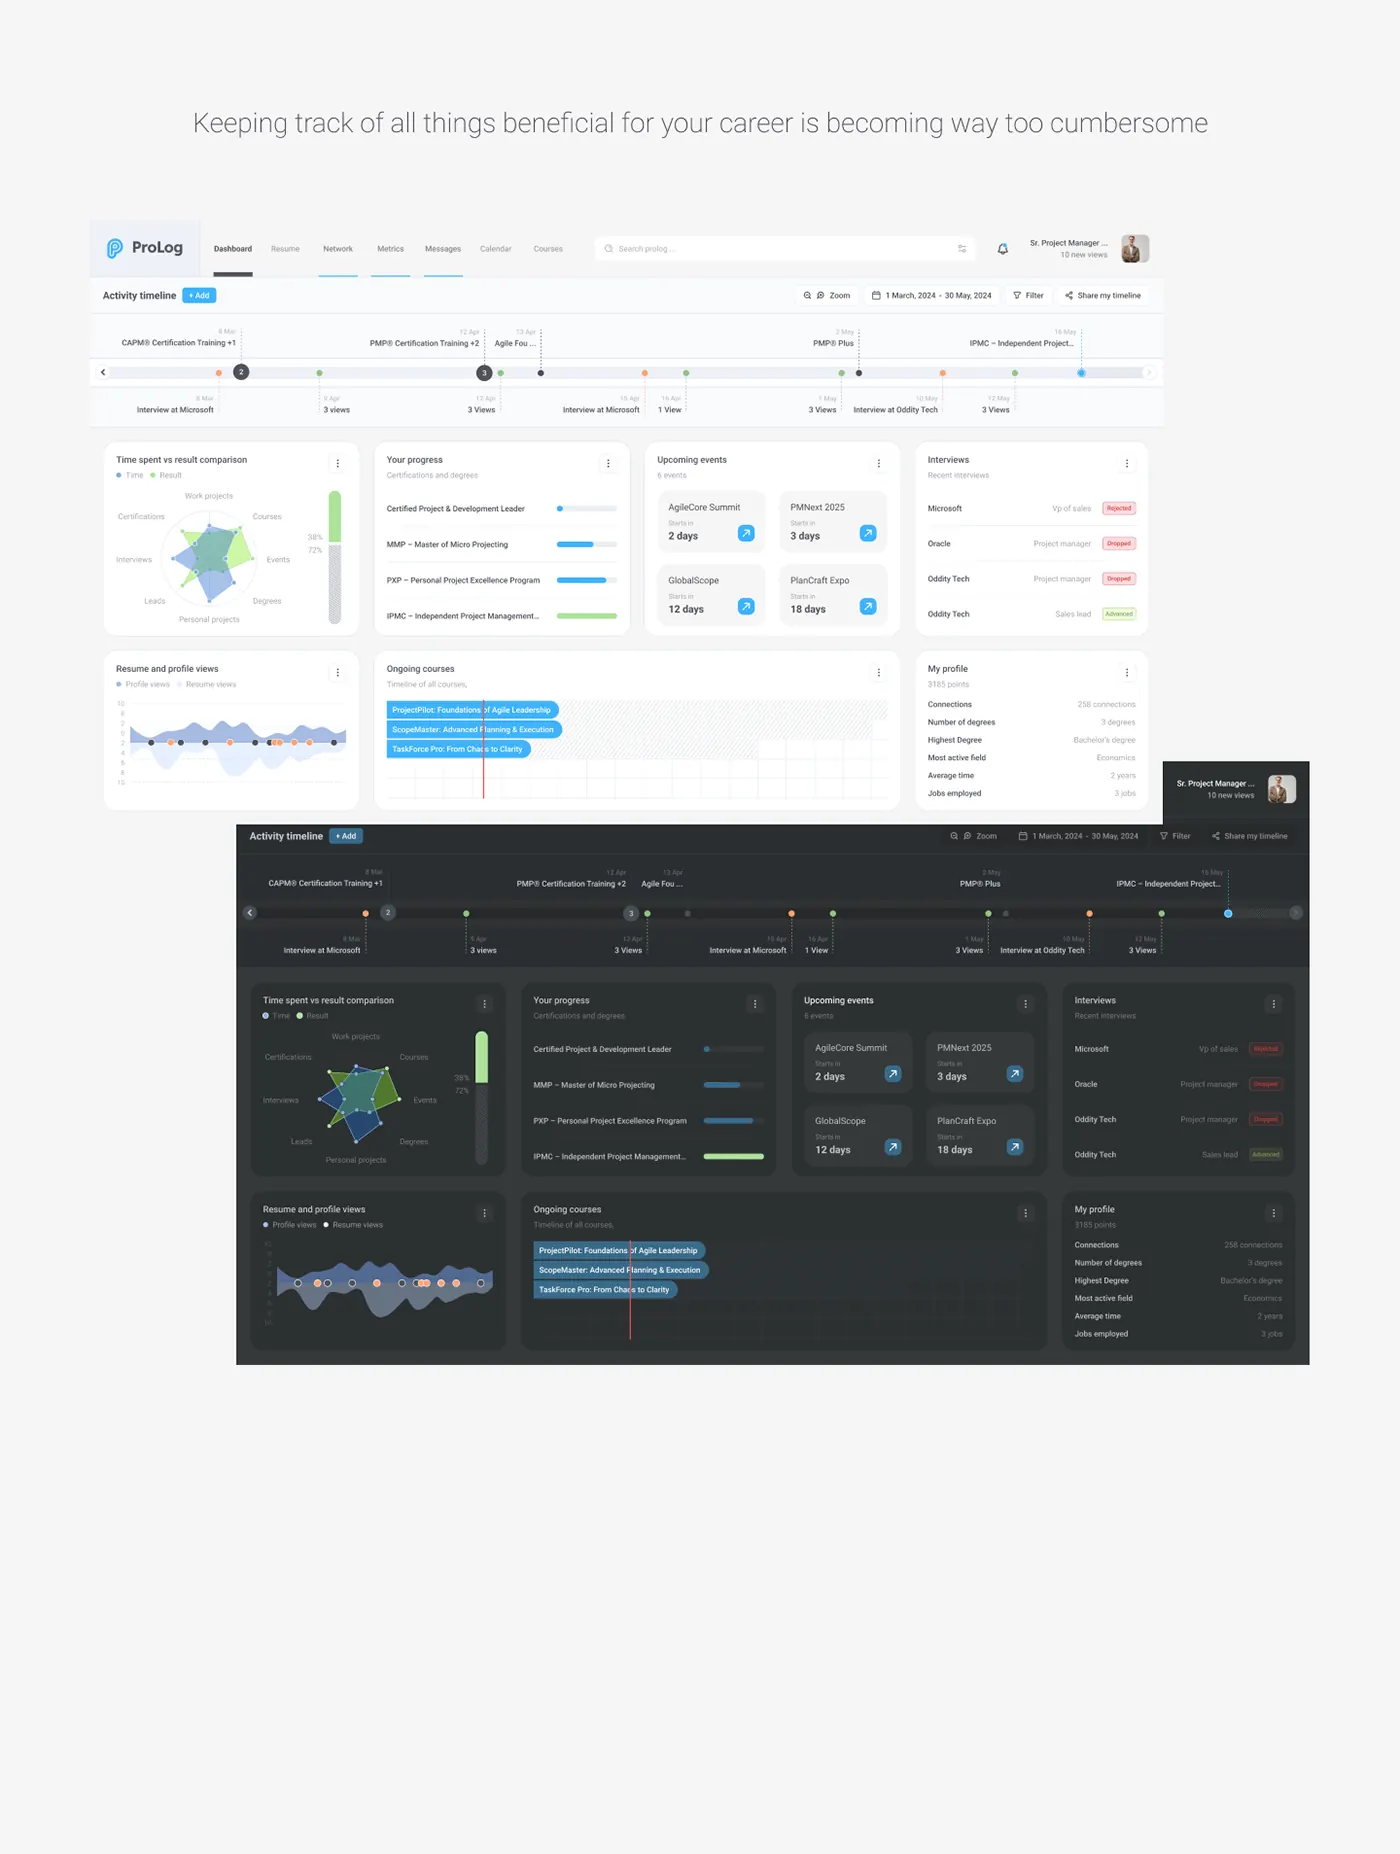
SolutionBuilt both themes from the same layout, keeping the sky blue and green accents and the status colours consistent.


Design library
- Sky blue#1E96E8Primary actions
- Progress green#8FD27AResults and progress
- Graphite#2C3032Text and dark theme
- Paper#F3F4F6Dashboard background
- Periwinkle#93B5CDTime and views
- Interview orange#F59A5BInterview markers
- Rejected red#E5484DRejected status
- Display · 26/500Activity timeline
- Title · 16/500Time spent vs result comparison
- Body · 14/400Certified Project & Development Leader
- Caption · 11/400Certifications and degrees
Timeline marker
One activity on the timeline: certifications above the track, interviews and views below.
- Marker
- Track
- Dot or cluster count
- Dashed stem
- Date
- Label
Certification progress row
One certification or degree with how far along it is; green once complete.
- Row
- Certification name
- Progress track
- Fill
- Percent
Event countdown card
An upcoming industry event, how many days until it starts, and a link out.
- Card
- Event name
- Caption
- Countdown
- Open link
Interview status row
Company, role and where the application stands.
- Row
- Company
- Role
- Status tag